
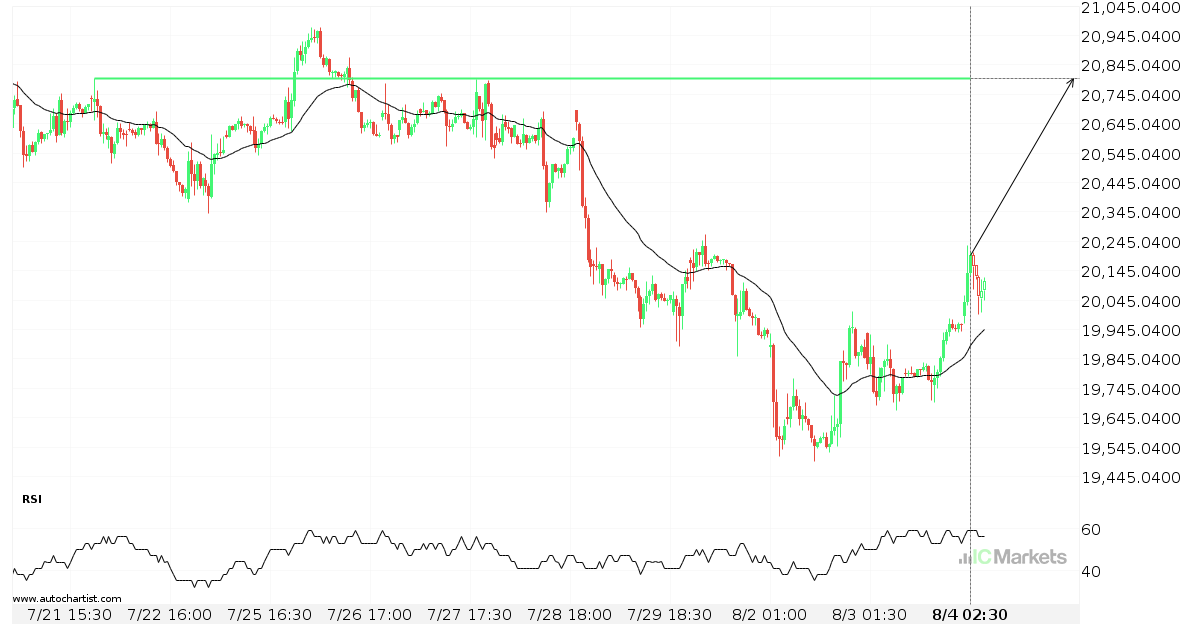
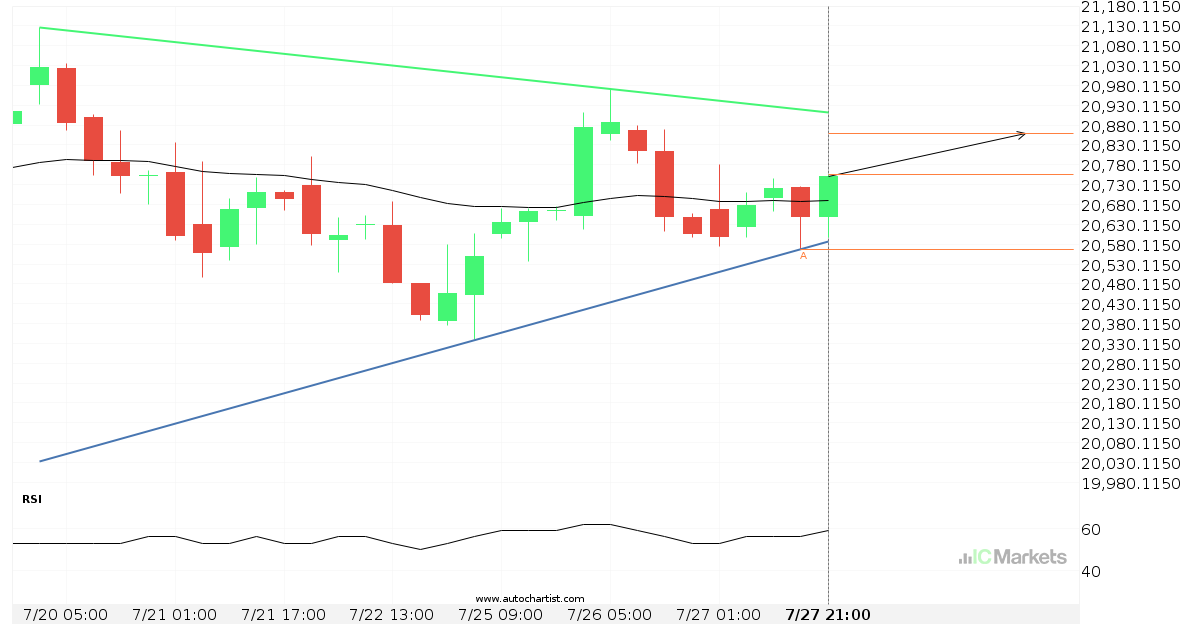
Hong Kong 50 Index approaching important 20799.9004 price line
Hong Kong 50 Index is approaching the resistance line of a Resistance. It has touched this line numerous times in the last 14 days. If it tests this line again, it could do so in the next 2 days.
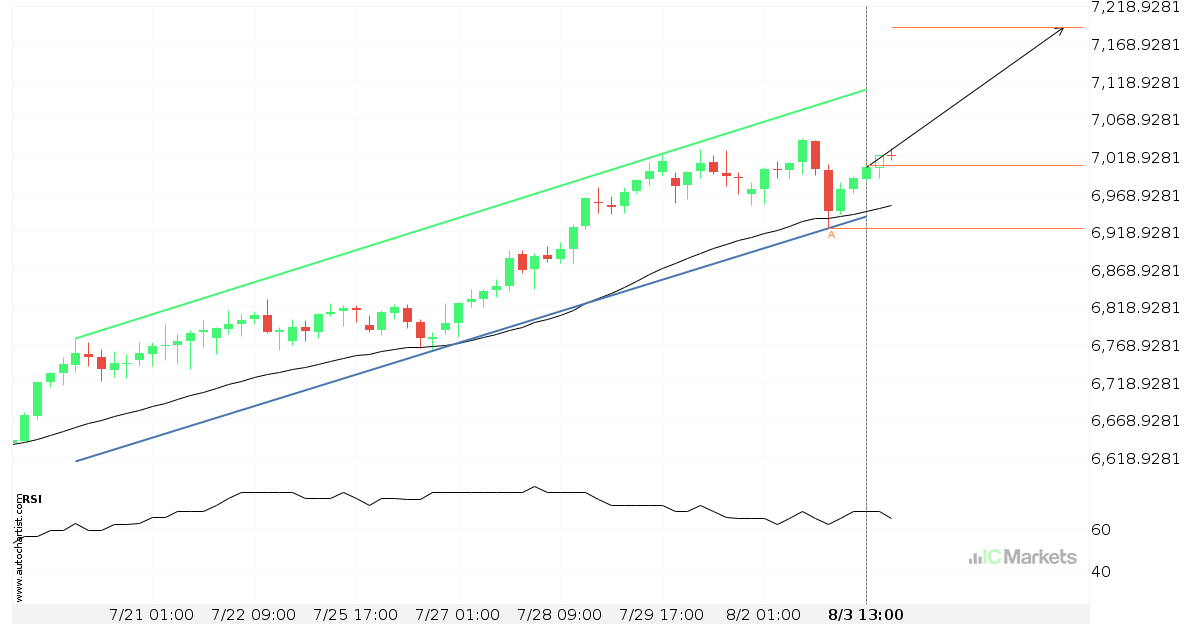
Will Australia 200 Index have enough momentum to break resistance?
Australia 200 Index is heading towards the resistance line of a Channel Up and could reach this point within the next 3 days. It has tested this line numerous times in the past, and this time could be no different from the past, ending in a rebound instead of a breakout. If the breakout doesn’t […]
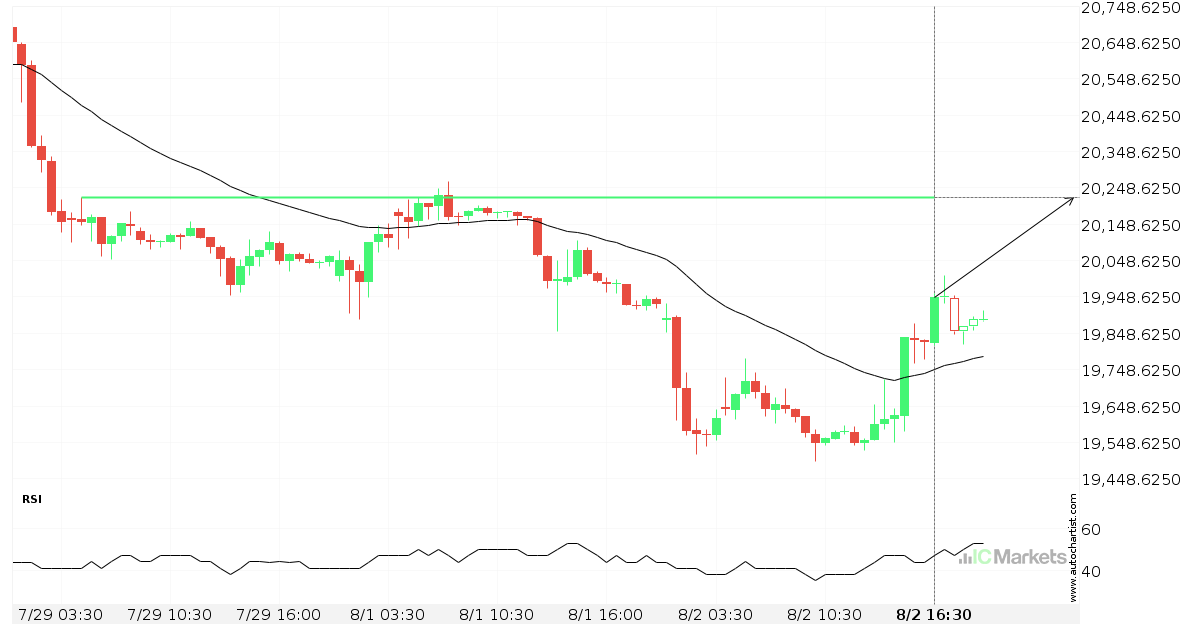
Breach of important price line imminent by Hong Kong 50 Index
Hong Kong 50 Index is moving towards a line of 20222.5000 which it has tested numerous times in the past. We have seen it retrace from this position in the past, so at this stage it isn’t clear whether it will breach this price or rebound as it did before. If Hong Kong 50 Index […]
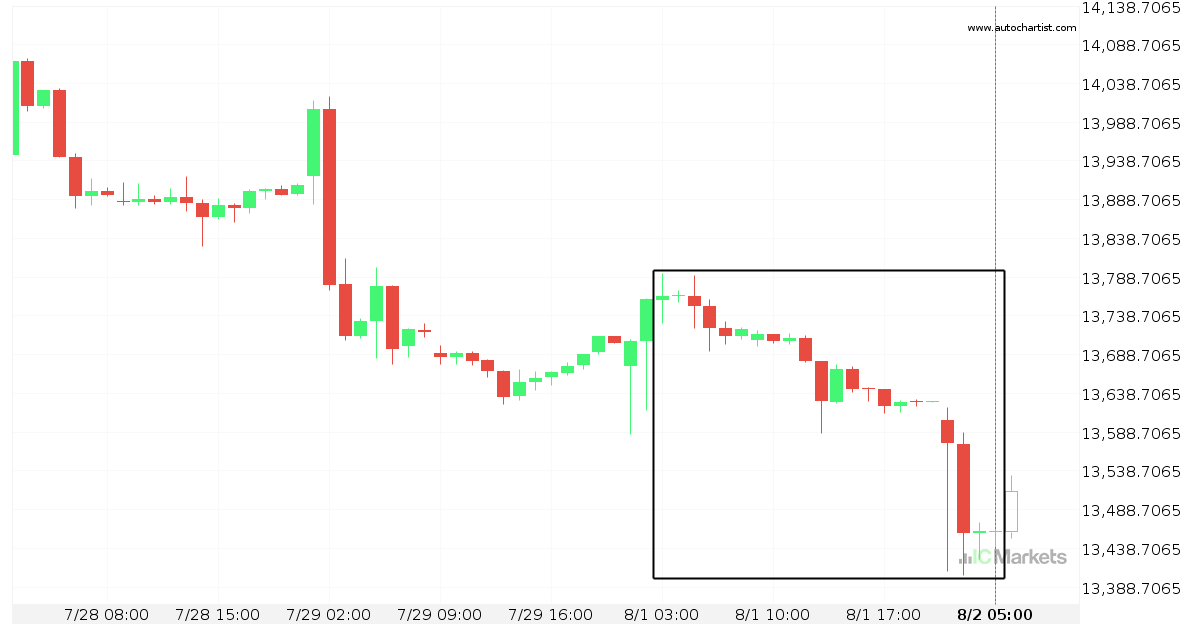
Huge bearish move on FTSE China A50 Index
FTSE China A50 Index has moved lower by 2.2% from 13758.9 to 13460.66 in the last 2 days.

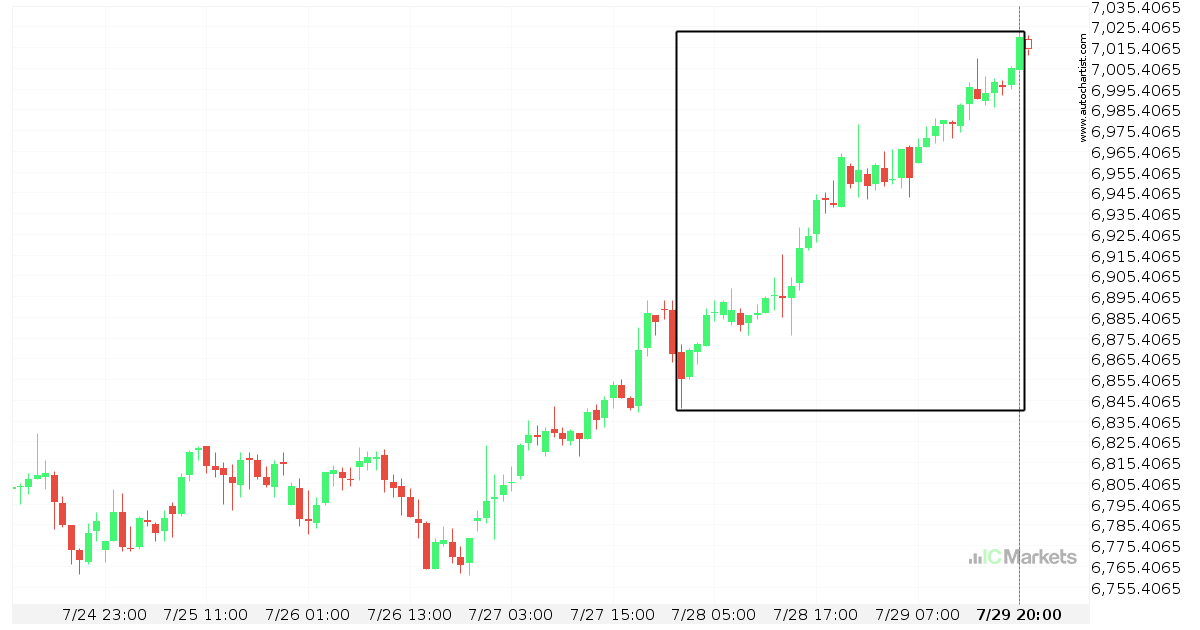
Huge bullish move on Australia 200 Index
Australia 200 Index has moved higher by 2.41% from 6868.45 to 7020.33 in the last 2 days.
Huge bullish move on Australia 200 Index
Australia 200 Index has moved higher by 2.41% from 6868.45 to 7020.33 in the last 2 days.
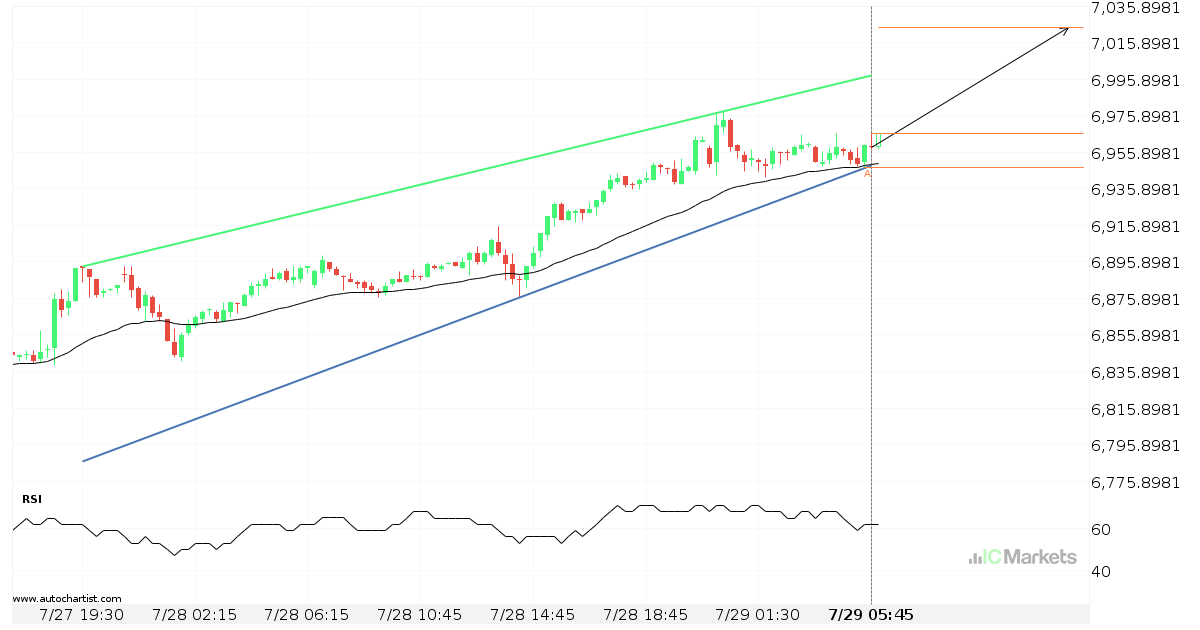
Will Australia 200 Index have enough momentum to break resistance?
Australia 200 Index is heading towards the resistance line of a Rising Wedge and could reach this point within the next 9 hours. It has tested this line numerous times in the past, and this time could be no different from the past, ending in a rebound instead of a breakout. If the breakout doesn’t […]
Hong Kong 50 Index – getting close to resistance of a Triangle
Hong Kong 50 Index is moving towards a resistance line. Because we have seen it retrace from this line before, we could see either a break through this line, or a rebound back to current levels. It has touched this line numerous times in the last 8 days and may test it again within the […]